When you need this. A team choosing a serving engine needs to know how many requests meet its latency target under bursts. A single fast request does not answer that question. Build a load generator that records completed requests, overload responses, and load-generator saturation.
What you run. Live requests to the local model endpoint, plus a separate generic scheduling simulation. No vLLM, SGLang, or TensorRT-LLM benchmark was executed.
This lesson builds on stream model output and stop work when the client disconnects.
Measure offered load and completed work
An open-loop generator schedules arrivals independently of completion. A closed-loop client submits its next request after the entire previous response completes. Both can be useful, but they represent different traffic sources. The downloadable scheduling experiment implements a single closed-loop client and enforces its admission capacity.
Goodput counts only completed requests meeting the stated service-level objective (SLO). The actual HTTP runner measures TTFT-only goodput and says so. SSE text events can contain multiple model tokens, so it records event gaps rather than calling them TPOT.
benchmark.py sends real HTTP requests at a configured offered rate. It caps client concurrency, counts locally shed requests, and retains server errors. lab.py separately models arrivals using generic scenarios; its coefficients are test inputs, not vLLM, SGLang, or TensorRT-LLM measurements.
Measure the endpoint
Download the lab from this page, extract it, and run these commands from its directory. The default command reads saved run records or runs the explicitly described local algorithm; it never downloads a model or calls a paid API.
python3 lab.py
python3 -m unittest -v test_lab.py
Read lab.py
"""Replay generic workload scenarios with assumed coefficients; use benchmark.py for actual HTTP measurements."""

from __future__ import annotations

from dataclasses import asdict, dataclass
import json
import math
import random


@dataclass(frozen=True)
class WorkloadRequest:
    request_id: str
    arrival_ms: float
    shared_prefix_tokens: int
    unique_prompt_tokens: int
    output_tokens: int


@dataclass(frozen=True)
class EngineProfile:
    name: str
    prefill_tokens_per_ms: float
    prefix_cache_hit_efficiency: float
    base_tpot_ms: float
    batch_tpot_slope_ms: float
    max_batch_slots: int


@dataclass(frozen=True)
class BenchmarkSummary:
    engine: str
    workload: str
    total_requests: int
    duration_s: float
    ttft_p50_ms: float
    ttft_p99_ms: float
    tpot_p50_ms: float
    tpot_p99_ms: float
    raw_output_tokens_per_s: float
    request_throughput_rps: float
    slo_goodput_rps: float
    slo_attainment_ratio: float


SCENARIO_PROFILES: dict[str, EngineProfile] = {
    "baseline": EngineProfile(
        name="baseline",
        prefill_tokens_per_ms=26.0,
        prefix_cache_hit_efficiency=0.45,
        base_tpot_ms=17.5,
        batch_tpot_slope_ms=0.62,
        max_batch_slots=16,
    ),
    "prefix_reuse": EngineProfile(
        name="prefix_reuse",
        prefill_tokens_per_ms=27.0,
        prefix_cache_hit_efficiency=0.92,
        base_tpot_ms=16.8,
        batch_tpot_slope_ms=0.58,
        max_batch_slots=16,
    ),
    "faster_decode": EngineProfile(
        name="faster_decode",
        prefill_tokens_per_ms=34.0,
        prefix_cache_hit_efficiency=0.50,
        base_tpot_ms=12.4,
        batch_tpot_slope_ms=0.44,
        max_batch_slots=16,
    ),
}


def build_agent_trace(
    num_requests: int = 80, seed: int = 42, mean_rps: float = 8.5
) -> list[WorkloadRequest]:
    rng = random.Random(seed)
    trace: list[WorkloadRequest] = []
    current_ms = 0.0
    for idx in range(num_requests):
        # Bursty gamma-like arrivals: alternating bursts (short inter-arrival) and lulls.
        burst_factor = 0.32 if (idx % 10) in (2, 3, 4, 5, 6) else 1.55
        inter_arrival_ms = rng.expovariate(mean_rps / 1000.0) * burst_factor
        current_ms += inter_arrival_ms
        shared_prefix = 3072 if idx % 4 != 0 else 2048
        unique_prompt = 256 + (idx % 5) * 64
        output_len = 96 + (idx % 4) * 32
        trace.append(
            WorkloadRequest(
                request_id=f"req-{idx:03d}",
                arrival_ms=round(current_ms, 2),
                shared_prefix_tokens=shared_prefix,
                unique_prompt_tokens=unique_prompt,
                output_tokens=output_len,
            )
        )
    return trace


def _percentile(sorted_vals: list[float], q: float) -> float:
    if not sorted_vals:
        return 0.0
    pos = min(len(sorted_vals) - 1, max(0, int(math.ceil(q * len(sorted_vals)) - 1)))
    return sorted_vals[pos]


def evaluate_engine_benchmark(
    trace: list[WorkloadRequest],
    profile: EngineProfile,
    workload_name: str = "agent-shared-prefix",
    ttft_slo_ms: float = 500.0,
    tpot_slo_ms: float = 35.0,
    closed_loop: bool = False,
) -> BenchmarkSummary:
    if profile.max_batch_slots < 1 or profile.prefill_tokens_per_ms <= 0:
        raise ValueError("Capacity and prefill rate must be positive")
    if not trace:
        raise ValueError("Workload trace must not be empty")

    prefill_free_at_ms = 0.0
    active_completions_ms: list[float] = []
    ttft_samples: list[float] = []
    tpot_samples: list[float] = []
    slo_passed = 0
    total_output_tokens = 0
    first_arrival_ms = trace[0].arrival_ms
    last_completion_ms = 0.0

    for req in trace:
        effective_arrival_ms = last_completion_ms if closed_loop else req.arrival_ms
        # Enforce admission capacity instead of merely capping the reported batch.
        occupied = sorted(t for t in active_completions_ms if t > effective_arrival_ms)
        admitted_at_ms = effective_arrival_ms
        if len(occupied) >= profile.max_batch_slots:
            admitted_at_ms = occupied[len(occupied) - profile.max_batch_slots]
        active_completions_ms = [t for t in active_completions_ms if t > admitted_at_ms]
        active_batch = min(profile.max_batch_slots, len(active_completions_ms) + 1)

        queue_wait_ms = max(admitted_at_ms, prefill_free_at_ms) - effective_arrival_ms
        uncached_shared = req.shared_prefix_tokens * (
            1.0 - profile.prefix_cache_hit_efficiency
        )
        effective_prefill_tokens = uncached_shared + req.unique_prompt_tokens
        prefill_ms = 3.0 + (effective_prefill_tokens / profile.prefill_tokens_per_ms)

        ttft_ms = queue_wait_ms + prefill_ms
        prefill_free_at_ms = effective_arrival_ms + ttft_ms

        tpot_ms = profile.base_tpot_ms + profile.batch_tpot_slope_ms * active_batch
        decode_ms = (req.output_tokens - 1) * tpot_ms
        completion_ms = effective_arrival_ms + ttft_ms + decode_ms

        active_completions_ms.append(completion_ms)
        last_completion_ms = max(last_completion_ms, completion_ms)
        ttft_samples.append(round(ttft_ms, 2))
        tpot_samples.append(round(tpot_ms, 2))
        total_output_tokens += req.output_tokens

        if ttft_ms <= ttft_slo_ms and tpot_ms <= tpot_slo_ms:
            slo_passed += 1

    ttft_sorted = sorted(ttft_samples)
    tpot_sorted = sorted(tpot_samples)
    duration_s = max(
        0.001,
        (last_completion_ms - (0.0 if closed_loop else first_arrival_ms)) / 1000.0,
    )

    return BenchmarkSummary(
        engine=profile.name,
        workload=workload_name,
        total_requests=len(trace),
        duration_s=round(duration_s, 3),
        ttft_p50_ms=round(_percentile(ttft_sorted, 0.50), 2),
        ttft_p99_ms=round(_percentile(ttft_sorted, 0.99), 2),
        tpot_p50_ms=round(_percentile(tpot_sorted, 0.50), 2),
        tpot_p99_ms=round(_percentile(tpot_sorted, 0.99), 2),
        raw_output_tokens_per_s=round(total_output_tokens / duration_s, 2),
        request_throughput_rps=round(len(trace) / duration_s, 3),
        slo_goodput_rps=round(slo_passed / duration_s, 3),
        slo_attainment_ratio=round(slo_passed / len(trace), 4),
    )


def main() -> None:
    trace = build_agent_trace(num_requests=80, seed=42, mean_rps=8.5)
    summaries = {
        name: asdict(evaluate_engine_benchmark(trace, profile))
        for name, profile in SCENARIO_PROFILES.items()
    }

    overbatched_trace = build_agent_trace(num_requests=80, seed=42, mean_rps=15.0)
    overbatched_profile = EngineProfile(
        name="overbatched_unbounded",
        prefill_tokens_per_ms=42.0,
        prefix_cache_hit_efficiency=0.50,
        base_tpot_ms=22.0,
        batch_tpot_slope_ms=0.45,
        max_batch_slots=48,
    )
    overbatched = evaluate_engine_benchmark(
        overbatched_trace,
        overbatched_profile,
        workload_name="overbatched-tail-violation",
    )
    closed_loop_baseline = evaluate_engine_benchmark(
        trace,
        SCENARIO_PROFILES["baseline"],
        workload_name="closed-loop-illusion",
        closed_loop=True,
    )

    report = {
        "experiment": "synthetic-arrival-and-goodput-scenarios",
        "execution_mode": "CPU simulation; arbitrary scenario coefficients, no serving engine executed",
        "scenario_assumptions": {k: asdict(v) for k, v in SCENARIO_PROFILES.items()},
        "slo_targets": {"ttft_slo_ms": 500.0, "tpot_slo_ms": 35.0},
        "trace_requests": len(trace),
        "scenario_comparisons": summaries,
        "diagnostics": {
            "overbatched_unbounded": asdict(overbatched),
            "closed_loop_baseline": asdict(closed_loop_baseline),
        },
    }
    print(
        json.dumps(
            {
                "execution_mode": "CPU algorithm with controlled inputs; any latency/capacity coefficients are assumptions",
                **report,
            },
            indent=2,
        )
    )


if __name__ == "__main__":
    main()
Read benchmark.py
"""Measure an actual SSE endpoint. A frame can contain multiple tokens: do not call frame gaps TPOT."""

import argparse
import concurrent.futures
import json
import math
import time
import urllib.error
import urllib.request


def request_one(url, prompt, limit):
    start = time.perf_counter()
    arrivals = []
    pieces = []
    saw_done = False
    req = urllib.request.Request(
        url,
        data=json.dumps({"prompt": prompt, "max_new_tokens": limit}).encode(),
        headers={"Content-Type": "application/json"},
    )
    try:
        with urllib.request.urlopen(req, timeout=120) as response:
            data = []
            for raw in response:
                line = raw.decode("utf-8").rstrip("\r\n")
                if line.startswith("data:"):
                    data.append(line[5:].lstrip(" "))
                elif not line and data:
                    event = "\n".join(data)
                    data = []
                    if event == "[DONE]":
                        saw_done = True
                        break
                    payload = json.loads(event)
                    if not isinstance(payload,dict): raise ValueError("Expected an event object")
                    piece = payload.get("token", "")
                    if not isinstance(piece,str):raise ValueError("Expected text content")
                    if piece:
                        arrivals.append(time.perf_counter() - start)
                        pieces.append(piece)
        if not saw_done:raise ValueError("Stream ended without a completion marker")
        end = time.perf_counter()
        return {
            "status": "completed",
            "ttft_ms": round(arrivals[0] * 1000, 3) if arrivals else None,
            "event_gaps_ms": [
                round((b - a) * 1000, 3) for a, b in zip(arrivals, arrivals[1:])
            ],
            "e2e_ms": round((end - start) * 1000, 3),
            "text": "".join(pieces),
            "content_events": len(pieces),
        }
    except (urllib.error.URLError, TimeoutError, ValueError) as e:
        return {
            "status": "failed",
            "error": str(e),
            "e2e_ms": round((time.perf_counter() - start) * 1000, 3),
        }


def run(url, prompts, limit=24, request_rate=1.0, max_in_flight=4, ttft_slo_ms=500):
    if not prompts or request_rate <= 0 or max_in_flight < 1:
        raise ValueError("Workload, rate and capacity must be positive")
    started = time.perf_counter()
    futures = []
    results = []
    local_shed = 0
    with concurrent.futures.ThreadPoolExecutor(max_workers=max_in_flight) as executor:
        for i, prompt in enumerate(prompts):
            delay = started + i / request_rate - time.perf_counter()
            if delay > 0:
                time.sleep(delay)
            # Do not silently queue inside the load generator: disclose local saturation.
            if sum(not f.done() for f in futures) >= max_in_flight:
                local_shed += 1
                continue
            futures.append(executor.submit(request_one, url, prompt, limit))
        results = [f.result() for f in futures]
    duration = time.perf_counter() - started
    passed = [
        r
        for r in results
        if r["status"] == "completed"
        and r["ttft_ms"] is not None
        and r["ttft_ms"] <= ttft_slo_ms
    ]
    return {
        "execution_mode": "live HTTP requests",
        "offered_requests": len(prompts),
        "client_shed_requests": local_shed,
        "duration_s": round(duration, 3),
        "ttft_slo_ms": ttft_slo_ms,
        "ttft_goodput_rps": round(len(passed) / duration, 4),
        "requests": results,
        "limits": "TTFT-only goodput; SSE events are not necessarily model tokens. Client saturation and failed responses are disclosed.",
    }


def main():
    p = argparse.ArgumentParser(description=__doc__)
    p.add_argument("--url", default="http://127.0.0.1:8766/generate")
    p.add_argument("--requests", type=int, default=6)
    p.add_argument("--rate", type=float, default=1)
    p.add_argument("--output", required=True)
    a = p.parse_args()
    report = run(
        a.url,
        ["Explain how a cache reduces repeated work."] * a.requests,
        request_rate=a.rate,
    )
    with open(a.output, "w") as f:
        json.dump(report, f, indent=2)
        f.write("\n")


if __name__ == "__main__":
    main()
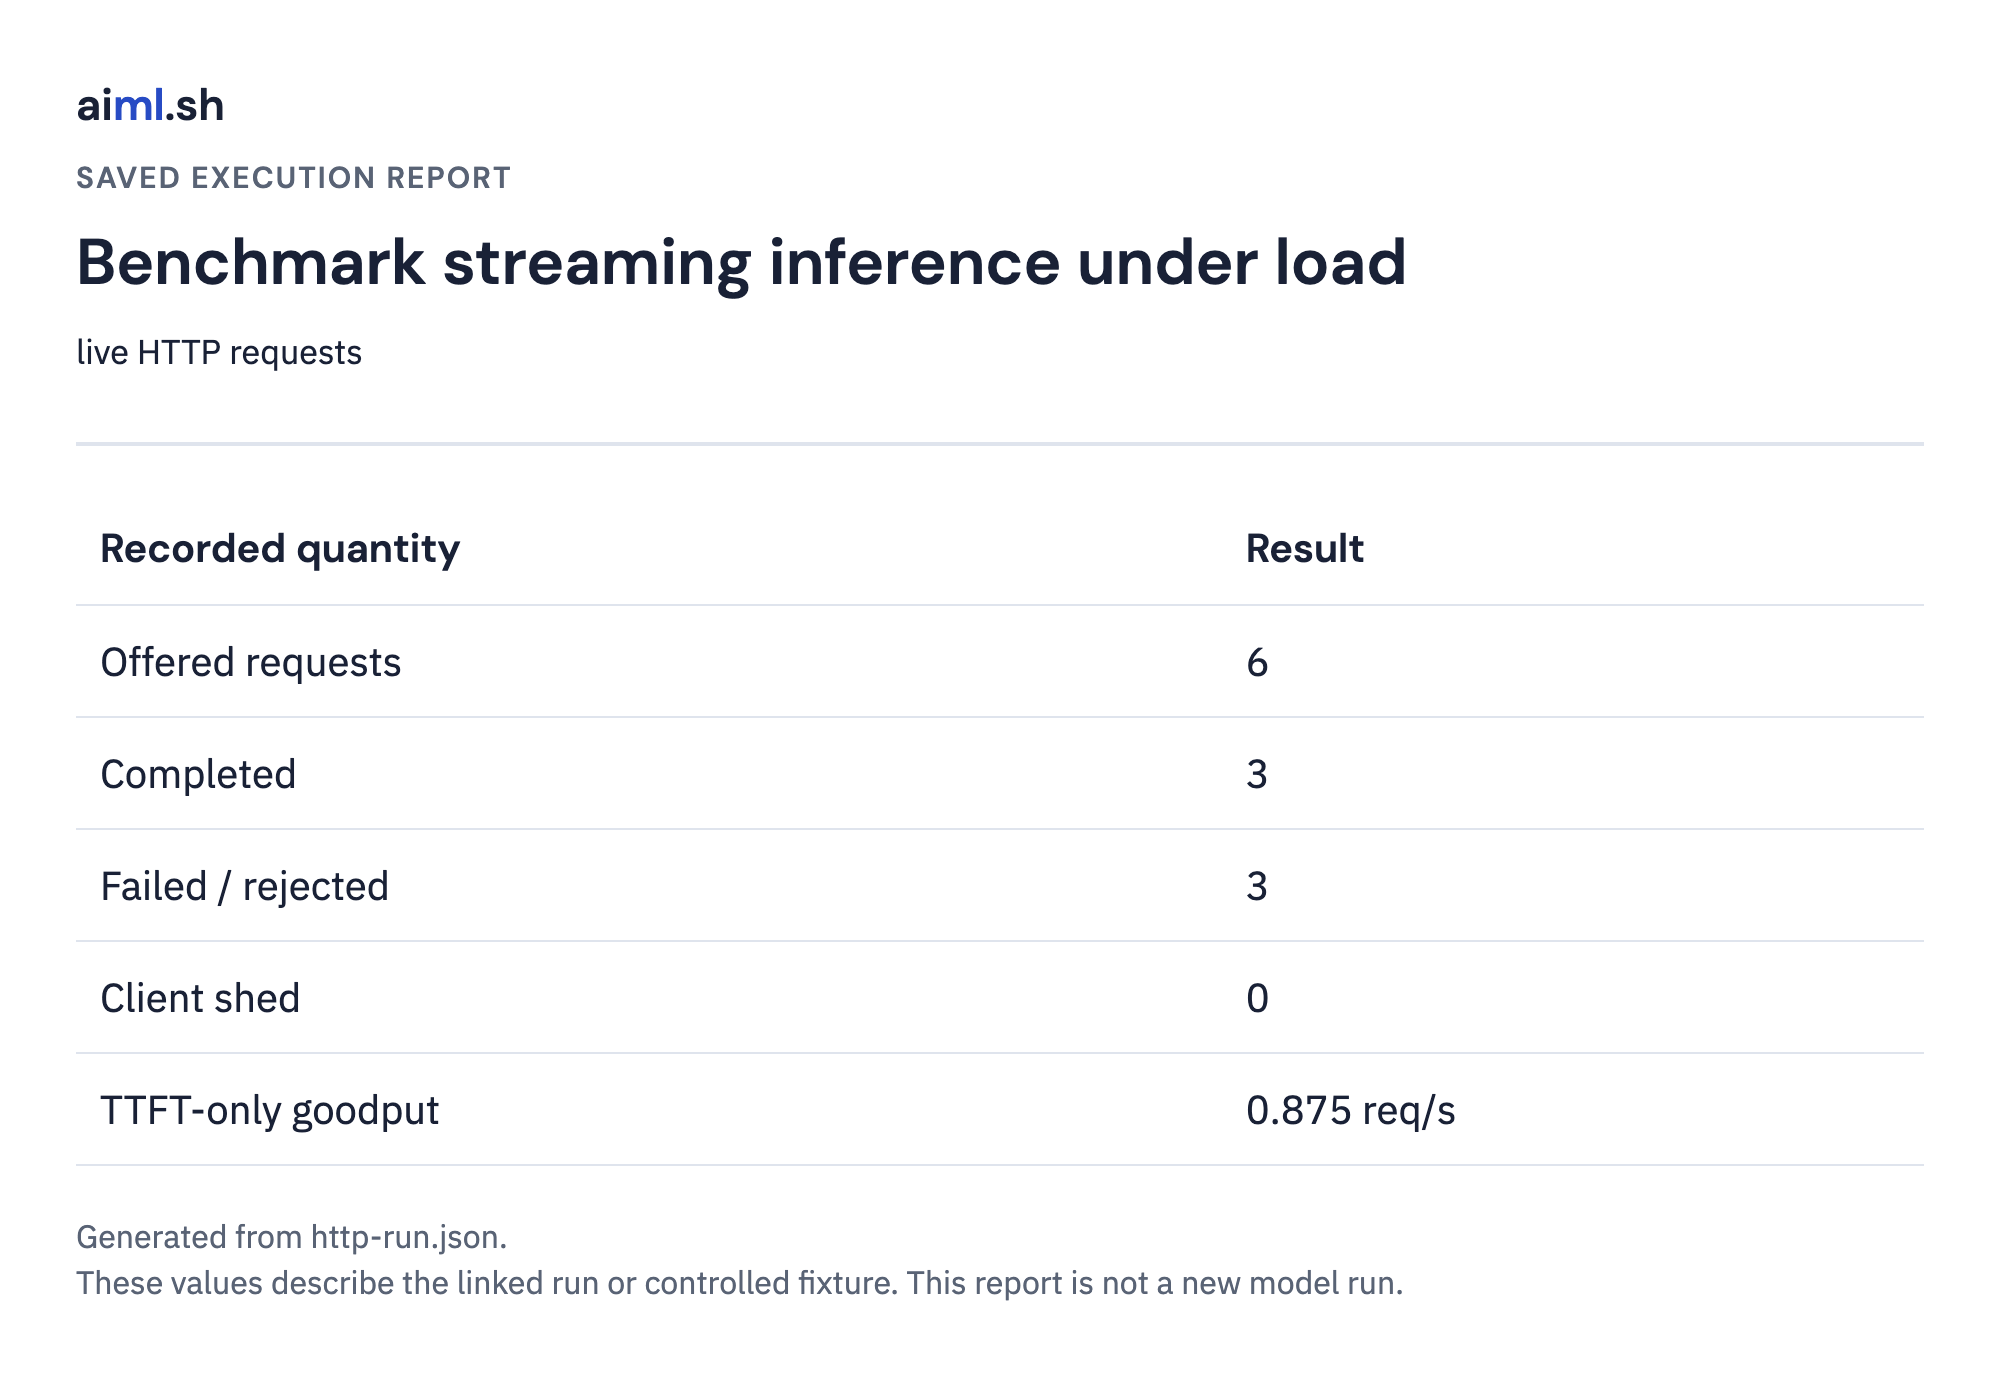
The table below belongs to the generic scheduler experiment, not an engine ranking. The separate live HTTP record includes actual overload responses. Count completions, failures, and rejections out of all offered requests. Goodput itself is qualifying completions divided by the observed duration.
| Quantity | Recorded value |
|---|---|
| Scenario requests | 80 |
| Baseline scenario TTFT p99 (ms) | 10235.3 |
| Closed-loop scenario TTFT p99 (ms) | 87.68 |
Inspect the complete local result
{
  "execution_mode": "CPU simulation; arbitrary scenario coefficients, no serving engine executed",
  "experiment": "synthetic-arrival-and-goodput-scenarios",
  "scenario_assumptions": {
    "baseline": {
      "name": "baseline",
      "prefill_tokens_per_ms": 26.0,
      "prefix_cache_hit_efficiency": 0.45,
      "base_tpot_ms": 17.5,
      "batch_tpot_slope_ms": 0.62,
      "max_batch_slots": 16
    },
    "prefix_reuse": {
      "name": "prefix_reuse",
      "prefill_tokens_per_ms": 27.0,
      "prefix_cache_hit_efficiency": 0.92,
      "base_tpot_ms": 16.8,
      "batch_tpot_slope_ms": 0.58,
      "max_batch_slots": 16
    },
    "faster_decode": {
      "name": "faster_decode",
      "prefill_tokens_per_ms": 34.0,
      "prefix_cache_hit_efficiency": 0.5,
      "base_tpot_ms": 12.4,
      "batch_tpot_slope_ms": 0.44,
      "max_batch_slots": 16
    }
  },
  "slo_targets": {
    "ttft_slo_ms": 500.0,
    "tpot_slo_ms": 35.0
  },
  "trace_requests": 80,
  "scenario_comparisons": {
    "baseline": {
      "engine": "baseline",
      "workload": "agent-shared-prefix",
      "total_requests": 80,
      "duration_s": 22.912,
      "ttft_p50_ms": 3915.16,
      "ttft_p99_ms": 10235.3,
      "tpot_p50_ms": 27.42,
      "tpot_p99_ms": 27.42,
      "raw_output_tokens_per_s": 502.8,
      "request_throughput_rps": 3.492,
      "slo_goodput_rps": 0.567,
      "slo_attainment_ratio": 0.1625
    },
    "prefix_reuse": {
      "engine": "prefix_reuse",
      "workload": "agent-shared-prefix",
      "total_requests": 80,
      "duration_s": 21.224,
      "ttft_p50_ms": 3271.8,
      "ttft_p99_ms": 8821.9,
      "tpot_p50_ms": 26.08,
      "tpot_p99_ms": 26.08,
      "raw_output_tokens_per_s": 542.79,
      "request_throughput_rps": 3.769,
      "slo_goodput_rps": 0.754,
      "slo_attainment_ratio": 0.2
    },
    "faster_decode": {
      "engine": "faster_decode",
      "workload": "agent-shared-prefix",
      "total_requests": 80,
      "duration_s": 16.256,
      "ttft_p50_ms": 1781.48,
      "ttft_p99_ms": 5103.64,
      "tpot_p50_ms": 19.44,
      "tpot_p99_ms": 19.44,
      "raw_output_tokens_per_s": 708.66,
      "request_throughput_rps": 4.921,
      "slo_goodput_rps": 0.984,
      "slo_attainment_ratio": 0.2
    }
  },
  "diagnostics": {
    "overbatched_unbounded": {
      "engine": "overbatched_unbounded",
      "workload": "overbatched-tail-violation",
      "total_requests": 80,
      "duration_s": 15.035,
      "ttft_p50_ms": 283.89,
      "ttft_p99_ms": 2491.42,
      "tpot_p50_ms": 40.0,
      "tpot_p99_ms": 43.6,
      "raw_output_tokens_per_s": 766.23,
      "request_throughput_rps": 5.321,
      "slo_goodput_rps": 1.862,
      "slo_attainment_ratio": 0.35
    },
    "closed_loop_baseline": {
      "engine": "baseline",
      "workload": "closed-loop-illusion",
      "total_requests": 80,
      "duration_s": 213.48,
      "ttft_p50_ms": 80.29,
      "ttft_p99_ms": 87.68,
      "tpot_p50_ms": 18.12,
      "tpot_p99_ms": 18.12,
      "raw_output_tokens_per_s": 53.96,
      "request_throughput_rps": 0.375,
      "slo_goodput_rps": 0.375,
      "slo_attainment_ratio": 1.0
    }
  }
}
Inspect the actual execution record
{
  "execution_mode": "live HTTP requests",
  "offered_requests": 6,
  "client_shed_requests": 0,
  "duration_s": 3.428,
  "ttft_slo_ms": 500,
  "ttft_goodput_rps": 0.875,
  "requests": [
    {
      "status": "completed",
      "ttft_ms": 286.882,
      "event_gaps_ms": [
        50.741,
        33.183,
        96.341,
        51.815,
        66.654,
        47.32,
        29.61,
        28.277,
        28.903,
        37.82,
        35.617,
        34.327,
        29.957,
        30.287,
        27.861,
        28.229,
        34.636,
        28.27,
        30.765,
        34.718,
        31.115,
        31.47,
        28.42
      ],
      "e2e_ms": 1163.249,
      "text": "A cache is a temporary storage device that stores frequently accessed data in memory. When a program needs to access a piece of",
      "content_events": 24
    },
    {
      "status": "failed",
      "error": "HTTP Error 429: Too Many Requests",
      "e2e_ms": 1.148
    },
    {
      "status": "failed",
      "error": "HTTP Error 429: Too Many Requests",
      "e2e_ms": 0.775
    },
    {
      "status": "completed",
      "ttft_ms": 42.988,
      "event_gaps_ms": [
        29.627,
        27.375,
        26.108,
        26.265,
        26.75,
        25.804,
        27.251,
        25.603,
        27.745,
        29.644,
        26.108,
        25.73,
        26.063,
        27.207,
        26.141,
        29.924,
        27.141,
        28.426,
        32.937,
        27.496,
        26.547,
        27.139,
        26.988
      ],
      "e2e_ms": 673.037,
      "text": "A cache is a temporary storage device that stores frequently accessed data in memory. When a program needs to access a piece of",
      "content_events": 24
    },
    {
      "status": "failed",
      "error": "HTTP Error 429: Too Many Requests",
      "e2e_ms": 1.011
    },
    {
      "status": "completed",
      "ttft_ms": 41.93,
      "event_gaps_ms": [
        31.872,
        27.103,
        26.454,
        26.67,
        26.131,
        25.989,
        34.774,
        41.762,
        34.019,
        27.688,
        27.436,
        27.602,
        54.374,
        31.225,
        28.678,
        56.612,
        48.569,
        50.115,
        54.832,
        61.134,
        47.739,
        51.438,
        43.673
      ],
      "e2e_ms": 927.88,
      "text": "A cache is a temporary storage device that stores frequently accessed data in memory. When a program needs to access a piece of",
      "content_events": 24
    }
  ],
  "limits": "TTFT-only goodput; SSE events are not necessarily model tokens. Client saturation and failed responses are disclosed.",
  "run_context": {
    "model": "Qwen/Qwen2.5-0.5B-Instruct",
    "revision": "7ae557604adf67be50417f59c2c2f167def9a775",
    "license": "Apache-2.0",
    "device": "M4 Pro / PyTorch MPS",
    "command": "python3 benchmark.py --url http://127.0.0.1:8767/generate --requests 6 --rate 2 --output http-run.json",
    "source_sha256": {
      "benchmark-vllm-sglang-and-tensorrt-llm-on-real-traffic/benchmark.py": "3ecbf214b284bfddf6b72f50987459a719fca3822eb9dd9c29a3fbfe67380785",
      "stream-tokens-over-sse-and-cancel-dropped-requests/server.py": "b019d96d81528e8b44ce25239ee0ba6942505375f8757ca6d6267681353d769a",
      "stream-tokens-over-sse-and-cancel-dropped-requests/live_inference.py": "754d9bf81d04694541e53d5c0472f984c9f046886070c33b376ca071c81c8086"
    },
    "scope": "Six development requests against a single local model slot; not an engine comparison or production load test."
  }
}
This image is an application-generated report of the saved program result, not a new inference run. Open the full-resolution report or read the raw result.
Read queueing and overload together
More offered load can increase throughput until queueing and rejection dominate. A bounded queue prevents unlimited waiting but rejects work. An unbounded client-side executor can hide the server’s saturation by queueing requests before transmission; this runner discloses local saturation instead.
Completion pacing. The closed-loop client waits for the previous full response, so its arrival pattern differs from the independently scheduled open-loop trace.
Latency objective. A completed response that misses the configured latency target contributes to throughput but not goodput. A stream without its completion marker is failed, even if some text arrived.
Read the executable checks
"""Checks the scheduler model, not any serving engine's performance."""

import unittest
from lab import (
    SCENARIO_PROFILES,
    EngineProfile,
    WorkloadRequest,
    build_agent_trace,
    evaluate_engine_benchmark,
)


class BenchmarkTests(unittest.TestCase):
    def test_closed_loop_benchmark_hides_queueing(self):
        # A single closed-loop client waits for the WHOLE prior response.
        profile = EngineProfile("fixed", 1, 0, 10, 0, 1)
        trace = [WorkloadRequest("a", 0, 0, 7, 3), WorkloadRequest("b", 0, 0, 7, 3)]
        result = evaluate_engine_benchmark(trace, profile, closed_loop=True)
        self.assertEqual(result.duration_s, 0.06)  # 2 * (10 prefill + 20 decode)
        self.assertEqual(result.ttft_p99_ms, 10)
        opened = evaluate_engine_benchmark(trace, profile)
        self.assertEqual(opened.ttft_p99_ms, 40)  # second arrival waits for admission

    def test_throughput_without_slo_masks_tail_violations(self):
        trace = build_agent_trace()
        result = evaluate_engine_benchmark(
            trace, SCENARIO_PROFILES["baseline"], tpot_slo_ms=1
        )
        self.assertGreater(result.raw_output_tokens_per_s, 0)
        self.assertEqual(result.slo_goodput_rps, 0)

    def test_admission_capacity_changes_queue_wait(self):
        trace = [WorkloadRequest(str(i), 0, 0, 7, 3) for i in range(3)]
        one = evaluate_engine_benchmark(trace, EngineProfile("one", 1, 0, 10, 0, 1))
        three = evaluate_engine_benchmark(trace, EngineProfile("three", 1, 0, 10, 0, 3))
        self.assertEqual(one.ttft_p99_ms, 70)
        self.assertEqual(three.ttft_p99_ms, 30)

    def test_invalid_capacity_is_rejected(self):
        with self.assertRaises(ValueError):
            evaluate_engine_benchmark(
                build_agent_trace(), EngineProfile("invalid", 1, 0, 10, 0, 0)
            )


class TransportCompletionTests(unittest.TestCase):
    def test_eof_without_done_is_failed(self):
        import io
        from unittest.mock import patch
        from benchmark import request_one

        with patch(
            "urllib.request.urlopen",
            return_value=io.BytesIO(b'data: {"token":"partial"}\n\n'),
        ):
            result = request_one("http://localhost/generate", "prompt", 24)
        self.assertEqual(result["status"], "failed")
        self.assertIn("completion marker", result["error"])

    def test_complete_stream_requires_done_marker(self):
        import io
        from unittest.mock import patch
        from benchmark import request_one

        with patch(
            "urllib.request.urlopen",
            return_value=io.BytesIO(b'data: {"token":"complete"}\n\ndata: [DONE]\n\n'),
        ):
            result = request_one("http://localhost/generate", "prompt", 24)
        self.assertEqual(result["status"], "completed")
        self.assertEqual(result["text"], "complete")


if __name__ == "__main__":
    unittest.main()


class GuardBoundaryTests(unittest.TestCase):
    def test_rejects_invalid_boundary_inputs_with_specific_reason(self):
        import lab
        cases = [('import benchmark\nbenchmark.run("unused",[])', 'Workload, rate'), ('evaluate_engine_benchmark([], EngineProfile("test",1,0,1,0,1))', 'Workload trace')]
        for code, reason in cases:
            with self.subTest(code=code):
                with self.assertRaisesRegex((ValueError, MemoryError, KeyError, RuntimeError), reason):
                    exec(code, vars(lab).copy())
Run this optional command only for the actual local endpoint or backend shown. Model paths refer to the first lesson’s explicit download; the server binds to loopback.
python3 benchmark.py --url http://127.0.0.1:8766/generate --requests 6 --rate 2 --output new-http-run.jsonTry a change and explain the result
Inspect the recorded HTTP responses. Count completions and overloads before looking at goodput. Repeat at a lower offered rate and predict which latency distribution changes. Do not rank engines from the generic scenario table.
Read the explanation
Useful capacity depends on what happens to all offered work. Accepted-only latency can hide overload.
Compare engines with equivalent workloads
For an engine comparison, hold model revision, precision, prompts, output limits, cache warmup, and hardware fixed. Use each engine’s official benchmark tools or an adapter with the same request contract. Report errors and sample size; this small local run cannot characterize production p99 latency.
References
- vLLM serving benchmark CLI.
- TensorRT-LLM benchmark metric definitions.
- AWS endpoint load-testing workflow.
Sources checked October 24, 2026. Runtime-specific commands and results apply to the recorded versions; linked rolling documentation can change. The application scenarios are teaching examples, not claims about an author’s production incident.