When you need this. A busy API has queued requests, yet responses remain slow. An accelerator utilization percentage alone cannot tell whether the limit is tokenization, host dispatch, synchronization, memory transfer, or model computation. Start with a timeline and a controlled measurement.
What you run. Actual CPU profiler events around Metal inference and an offline record validator. No NVIDIA utilization, occupancy, or CUDA graph result is claimed.
This lesson builds on choose a latency-throughput operating point.
Collect a focused execution profile
A device can be busy without efficiently using its arithmetic units, and a low average busy fraction can hide short bursts. Host calls such as converting a device tensor to a Python scalar can introduce synchronization. Separate queueing, CPU preprocessing, dispatch, and device work before proposing a fix.
The real profiler records CPU operator events around a synchronized local model forward. Those event durations are not GPU kernel durations or SM occupancy. The report does not invent a busy fraction or identify these events as nvidia-smi samples.
profile_live.py records actual operator names, call counts, host-side durations, and total profiled wall time. rank_operators() validates and orders those records without assigning a GPU bottleneck from host time alone.
Read the recorded operator profile
Download the lab from this page, extract it, and run these commands from its directory. The default command reads saved run records or runs the explicitly described local algorithm; it never downloads a model or calls a paid API.
python3 lab.py
python3 -m unittest -v test_lab.py
Read lab.py
"""Rank actual host operator records without inferring GPU utilization."""

import json, math
from pathlib import Path


def rank_operators(rows):
    if not rows:
        raise ValueError("Operator records are required")
    if any(
        not math.isfinite(r["self_cpu_us"]) or r["self_cpu_us"] < 0 or r["calls"] < 1
        for r in rows
    ):
        raise ValueError("Invalid host operator record")
    return sorted(rows, key=lambda r: r["self_cpu_us"], reverse=True)


def main():
    record = json.loads(Path("profile-run.json").read_text())
    print(
        json.dumps(
            {
                "execution_mode": "offline analysis of actual CPU profiler events around Metal model execution",
                "profiled_wall_ms": record["profiled_wall_ms"],
                "top_host_operators": rank_operators(record["operators"]),
                "limits": "Host operator time is not GPU kernel time, GPU utilization or device bandwidth. Profiling changes execution.",
            },
            indent=2,
        )
    )


if __name__ == "__main__":
    main()
Read profile_live.py
"""Collect actual CPU operator events around synchronized local model forwards on Metal."""

import argparse
import hashlib
import json
import platform
import time
from pathlib import Path


def main():
    p = argparse.ArgumentParser()
    p.add_argument("--model-path", required=True)
    p.add_argument("--output", required=True)
    a = p.parse_args()
    import torch, transformers
    from transformers import AutoTokenizer, AutoModelForCausalLM

    tokenizer = AutoTokenizer.from_pretrained(a.model_path, local_files_only=True)
    model = (
        AutoModelForCausalLM.from_pretrained(
            a.model_path,
            local_files_only=True,
            dtype=torch.float32,
            attn_implementation="eager",
        )
        .eval()
        .to("mps")
    )
    ids = tokenizer(
        "A code assistant retrieves relevant functions before generating a patch.",
        return_tensors="pt",
    )["input_ids"].to("mps")
    with torch.inference_mode():
        model(ids, use_cache=True)
    torch.mps.synchronize()
    start = time.perf_counter()
    with torch.profiler.profile(
        activities=[torch.profiler.ProfilerActivity.CPU], record_shapes=True
    ) as prof:
        with torch.inference_mode():
            result = model(ids, use_cache=True)
            torch.mps.synchronize()
    elapsed = (time.perf_counter() - start) * 1000
    rows = sorted(
        prof.key_averages(), key=lambda x: x.self_cpu_time_total, reverse=True
    )[:12]
    result = {
        "execution_mode": "fresh local inference; CPU operator profiler around Metal execution",
        "environment": {
            "torch": torch.__version__,
            "transformers": transformers.__version__,
            "platform": platform.platform(),
            "python": platform.python_version(),
        },
        "model_id": "Qwen/Qwen2.5-0.5B-Instruct",
        "model_revision": "7ae557604adf67be50417f59c2c2f167def9a775",
        "source_sha256": hashlib.sha256(Path(__file__).read_bytes()).hexdigest(),
        "profiled_wall_ms": round(elapsed, 3),
        "operators": [
            {
                "name": x.key,
                "calls": x.count,
                "self_cpu_us": round(x.self_cpu_time_total, 3),
            }
            for x in rows
        ],
        "limits": "CPU operator durations include dispatch and synchronization overhead, not GPU kernel duration or occupancy. Profiling changes runtime; compare unprofiled repetitions separately.",
    }
    Path(a.output).write_text(json.dumps(result, indent=2) + "\n")


if __name__ == "__main__":
    main()
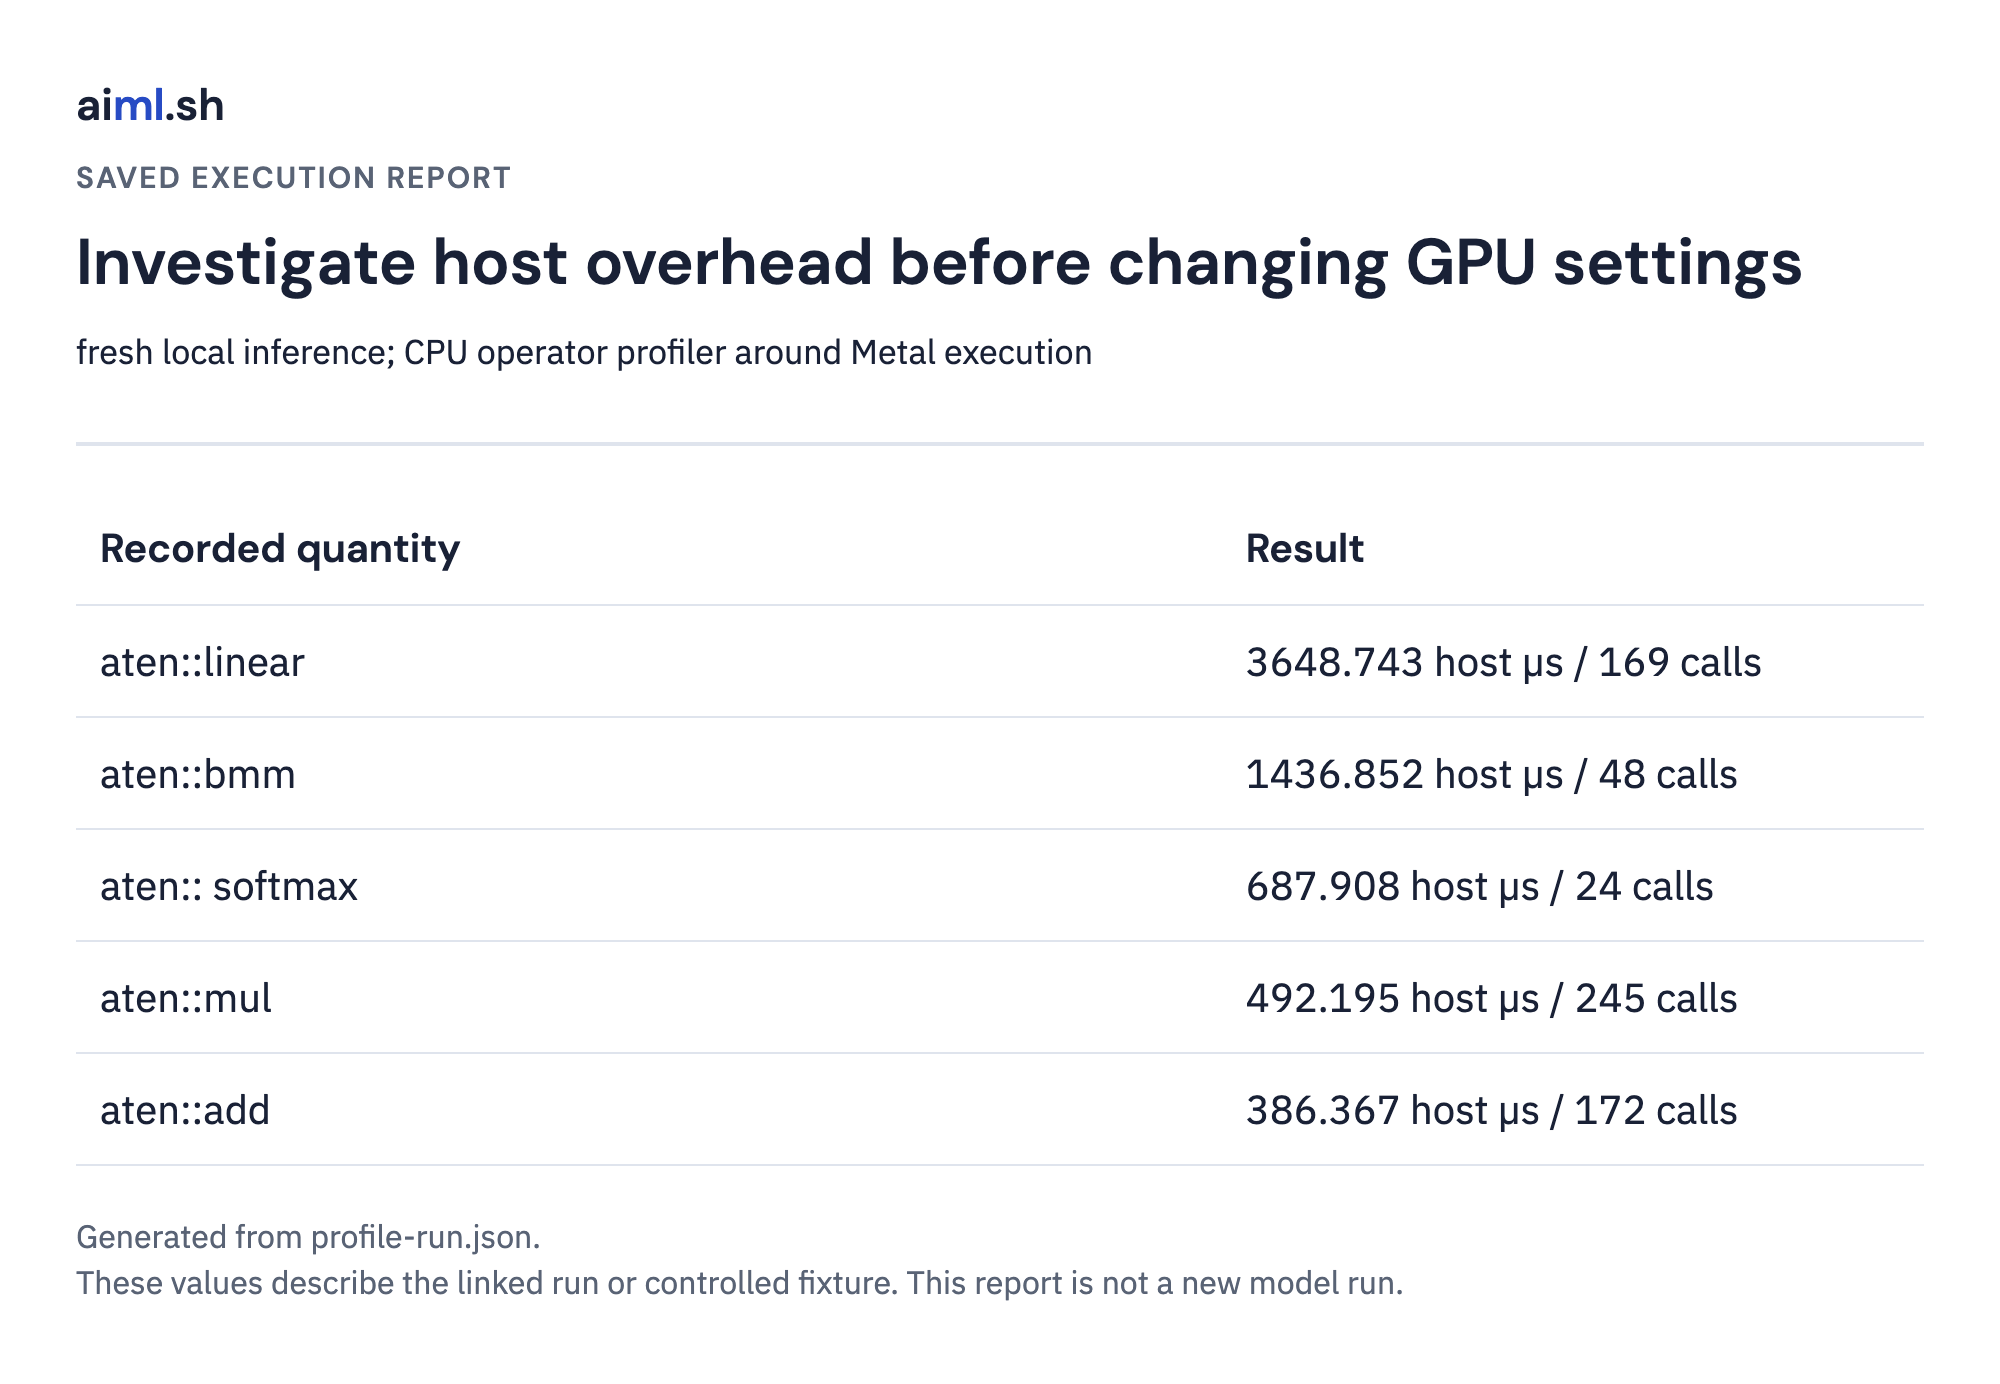
The actual operator records identify where to investigate host work. They cannot establish GPU occupancy or kernel bandwidth. Keep the profiled wall time separate from unprofiled latency because instrumentation changes execution.
Inspect the complete local result
{
  "execution_mode": "offline analysis of actual CPU profiler events around Metal model execution",
  "profiled_wall_ms": 55.753,
  "top_host_operators": [
    {
      "name": "aten::linear",
      "calls": 169,
      "self_cpu_us": 3648.743
    },
    {
      "name": "aten::bmm",
      "calls": 48,
      "self_cpu_us": 1436.852
    },
    {
      "name": "aten::_softmax",
      "calls": 24,
      "self_cpu_us": 687.908
    },
    {
      "name": "aten::mul",
      "calls": 245,
      "self_cpu_us": 492.195
    },
    {
      "name": "aten::add",
      "calls": 172,
      "self_cpu_us": 386.367
    },
    {
      "name": "aten::copy_",
      "calls": 196,
      "self_cpu_us": 216.708
    },
    {
      "name": "aten::cat",
      "calls": 97,
      "self_cpu_us": 187.702
    },
    {
      "name": "aten::empty",
      "calls": 298,
      "self_cpu_us": 153.942
    },
    {
      "name": "aten::flatten",
      "calls": 338,
      "self_cpu_us": 124.089
    },
    {
      "name": "aten::matmul",
      "calls": 48,
      "self_cpu_us": 117.886
    },
    {
      "name": "aten::pow",
      "calls": 49,
      "self_cpu_us": 112.667
    },
    {
      "name": "aten::_to_copy",
      "calls": 124,
      "self_cpu_us": 106.667
    }
  ],
  "limits": "Host operator time is not GPU kernel time, GPU utilization or device bandwidth. Profiling changes execution."
}
Inspect the actual execution record
{
  "execution_mode": "fresh local inference; CPU operator profiler around Metal execution",
  "environment": {
    "torch": "2.14.1",
    "transformers": "5.20.2",
    "platform": "macOS-27.0.1-arm64-arm-64bit",
    "python": "3.12.8"
  },
  "model_id": "Qwen/Qwen2.5-0.5B-Instruct",
  "model_revision": "7ae557604adf67be50417f59c2c2f167def9a775",
  "source_sha256": "f09d10cf253f5c7cc013997835f56d5aced87588786efa1e575bef4bc04334da",
  "profiled_wall_ms": 55.753,
  "operators": [
    {
      "name": "aten::linear",
      "calls": 169,
      "self_cpu_us": 3648.743
    },
    {
      "name": "aten::bmm",
      "calls": 48,
      "self_cpu_us": 1436.852
    },
    {
      "name": "aten::_softmax",
      "calls": 24,
      "self_cpu_us": 687.908
    },
    {
      "name": "aten::mul",
      "calls": 245,
      "self_cpu_us": 492.195
    },
    {
      "name": "aten::add",
      "calls": 172,
      "self_cpu_us": 386.367
    },
    {
      "name": "aten::copy_",
      "calls": 196,
      "self_cpu_us": 216.708
    },
    {
      "name": "aten::cat",
      "calls": 97,
      "self_cpu_us": 187.702
    },
    {
      "name": "aten::empty",
      "calls": 298,
      "self_cpu_us": 153.942
    },
    {
      "name": "aten::flatten",
      "calls": 338,
      "self_cpu_us": 124.089
    },
    {
      "name": "aten::matmul",
      "calls": 48,
      "self_cpu_us": 117.886
    },
    {
      "name": "aten::pow",
      "calls": 49,
      "self_cpu_us": 112.667
    },
    {
      "name": "aten::_to_copy",
      "calls": 124,
      "self_cpu_us": 106.667
    }
  ],
  "limits": "CPU operator durations include dispatch and synchronization overhead, not GPU kernel duration or occupancy. Profiling changes runtime; compare unprofiled repetitions separately."
}
This image is an application-generated report of the saved program result, not a new inference run. Open the full-resolution report or read the raw result.
Distinguish host overhead from device work
Profiling adds overhead and can alter execution. Moving tokenization into a worker pool may improve request overlap but add coordination costs. Capturing a CUDA graph can reduce repeated launch overhead on a supported NVIDIA runtime, but it does not fix every memory or scheduling bottleneck and was not executed here.
Missing operator records. An empty profile is rejected instead of returning a confident diagnosis with no observed events.
Invalid host duration. Negative or nonfinite operator durations fail validation. A valid host event still cannot be interpreted as a GPU kernel measurement.
Read the executable checks
import unittest
from lab import rank_operators


class ProfileTests(unittest.TestCase):
    def test_rank_uses_actual_host_duration(self):
        rows = [
            {"name": "b", "calls": 2, "self_cpu_us": 3},
            {"name": "a", "calls": 1, "self_cpu_us": 7},
        ]
        self.assertEqual(rank_operators(rows)[0]["name"], "a")

    def test_empty_profile_is_rejected(self):
        with self.assertRaises(ValueError):
            rank_operators([])

    def test_nonfinite_duration_is_rejected(self):
        for value in [float("nan"), float("inf"), -1]:
            with self.assertRaises(ValueError):
                rank_operators([{"name": "a", "calls": 1, "self_cpu_us": value}])


if __name__ == "__main__":
    unittest.main()
Use the pinned live runtime from the first lesson for model commands. A path placeholder refers to your explicitly downloaded model; these commands do not fetch one automatically.
python3 -m venv .venv
.venv/bin/python -m pip install -r requirements-live.txt
.venv/bin/python profile_live.py --model-path /path/to/downloaded/model --output new-profile-run.json
Try a change and explain the result
Inspect the real top host-side operators. Identify what additional device trace would be needed before calling one a GPU bottleneck. Repeat a focused profile after one implementation change, then compare unprofiled latency separately.
Read the explanation
Host operator events describe host-side work. Device kernel duration and utilization need appropriate device profiling.
Validate one change at a time
Start with an unprofiled baseline, collect a focused profile, change one cause, then repeat the baseline. Use Nsight Systems for NVIDIA timelines and Nsight Compute for selected kernels. Do not infer a whole-model speedup from a single utilization metric.
References
Sources checked October 24, 2026. Runtime-specific commands and results apply to the recorded versions; linked rolling documentation can change. The application scenarios are teaching examples, not claims about an author’s production incident.