When you need this. A code assistant feels normal most of the time, but some requests pause for seconds. An average hides these outliers. Build a report that relates per-request latency to queue wait, context, cache pressure, and preemption records.
What you run. Executable telemetry aggregation over controlled log fixtures; diagnosis labels are test hypotheses, not a recorded GPU incident.
This lesson builds on compare eager and compiled normalization on real tensors.
Relate request timing to server pressure
A latency percentile describes the sampled requests and measurement window. A high p99 may come from queueing, a long prompt, output length, recomputation, transport, or another dependency. Correlation suggests an investigation; it does not prove a root cause.
KV preemption can require recomputing earlier work in a serving engine. To diagnose it, correlate engine counters with request-level timing and load. The lab includes controlled log windows with known labels, so its diagnosis rules can be inspected. The labels are hypotheses for real incidents, not an automatic explanation of the cause.
diagnose_p99_spike() aggregates request records and returns a rule-based interpretation. The controlled windows test how outliers and queueing affect the report. The real HTTP benchmark from the earlier lesson provides a separate small request record with both successes and overloads.
Run the telemetry report
Download the lab from this page, extract it, and run these commands from its directory. The default command reads saved run records or runs the explicitly described local algorithm; it never downloads a model or calls a paid API.
python3 lab.py
python3 -m unittest -v test_lab.py
Read lab.py
"""Aggregate controlled request logs and report tail-latency diagnostic hypotheses."""

from __future__ import annotations

from dataclasses import asdict, dataclass
import json
import math


@dataclass(frozen=True)
class RequestLog:
    request_id: str
    prompt_tokens: int
    output_tokens: int
    queue_wait_ms: float
    prefill_ms: float
    decode_tpot_ms: float
    preempted: bool
    recompute_penalty_ms: float
    prefix_cached_tokens: int
    kv_occupancy_pct_at_arrival: float

    def __post_init__(self):
        if (
            self.prompt_tokens < 1
            or self.output_tokens < 1
            or not 0 <= self.prefix_cached_tokens <= self.prompt_tokens
        ):
            raise ValueError("Invalid completed request token counts")
        values = [
            self.queue_wait_ms,
            self.prefill_ms,
            self.decode_tpot_ms,
            self.recompute_penalty_ms,
            self.kv_occupancy_pct_at_arrival,
        ]
        if (
            any(not math.isfinite(v) or v < 0 for v in values)
            or self.kv_occupancy_pct_at_arrival > 100
        ):
            raise ValueError("Invalid completed request measurements")

    @property
    def ttft_ms(self) -> float:
        return self.queue_wait_ms + self.prefill_ms

    @property
    def e2e_ms(self) -> float:
        return (
            self.ttft_ms
            + (max(0, self.output_tokens - 1) * self.decode_tpot_ms)
            + self.recompute_penalty_ms
        )


@dataclass(frozen=True)
class TelemetrySnapshot:
    window_name: str
    request_count: int
    mean_e2e_ms: float
    p50_e2e_ms: float
    p95_e2e_ms: float
    p99_e2e_ms: float
    p99_to_p50_ratio: float | None
    p50_ttft_ms: float
    p99_ttft_ms: float
    p50_tpot_ms: float | None
    p99_tpot_ms: float | None
    p99_queue_wait_ms: float
    peak_kv_occupancy_pct: float
    preemption_count: int
    estimated_recompute_tokens: int
    prefix_cache_hit_rate_pct: float
    modeled_cost_per_1k_requests_usd: float
    diagnostic_hypothesis: str


def percentile(values: list[float], q: float) -> float:
    if not values:
        raise ValueError("Cannot compute percentile of empty list")
    ordered = sorted(values)
    idx = min(len(ordered) - 1, max(0, math.ceil((q / 100.0) * len(ordered)) - 1))
    return ordered[idx]


def diagnose_p99_spike(
    window_name: str,
    logs: list[RequestLog],
    gpu_hourly_cost_usd: float = 4.00,
    effective_concurrency: float = 32.0,
) -> TelemetrySnapshot:
    if not logs:
        raise ValueError("logs must not be empty")

    e2e_vals = [r.e2e_ms for r in logs]
    ttft_vals = [r.ttft_ms for r in logs]
    tpot_vals = [
        r.decode_tpot_ms + (r.recompute_penalty_ms / (r.output_tokens - 1))
        for r in logs if r.output_tokens > 1
    ]
    queue_vals = [r.queue_wait_ms for r in logs]

    mean_e2e = sum(e2e_vals) / len(e2e_vals)
    p50_e2e = percentile(e2e_vals, 50.0)
    p95_e2e = percentile(e2e_vals, 95.0)
    p99_e2e = percentile(e2e_vals, 99.0)
    ratio = p99_e2e / p50_e2e if p50_e2e else None

    p50_ttft = percentile(ttft_vals, 50.0)
    p99_ttft = percentile(ttft_vals, 99.0)
    p50_tpot = percentile(tpot_vals, 50.0) if tpot_vals else None
    p99_tpot = percentile(tpot_vals, 99.0) if tpot_vals else None
    p99_queue = percentile(queue_vals, 99.0)

    peak_kv = max(r.kv_occupancy_pct_at_arrival for r in logs)
    preemptions = sum(1 for r in logs if r.preempted)
    recompute_tokens = sum(
        (r.prompt_tokens + r.output_tokens // 2) for r in logs if r.preempted
    )

    total_prompt = sum(r.prompt_tokens for r in logs)
    cached_prompt = sum(r.prefix_cached_tokens for r in logs)
    prefix_hit_pct = (cached_prompt / total_prompt) * 100.0 if total_prompt else 0.0

    # Illustrative allocation proxy includes waiting; it is not measured GPU usage or a bill.
    avg_gpu_s_per_req = (mean_e2e / 1000.0) / effective_concurrency
    cost_per_1k = avg_gpu_s_per_req * 1000.0 * (gpu_hourly_cost_usd / 3600.0)

    if preemptions > 0 and peak_kv >= 95.0:
        diagnostic_hypothesis = "kv_cache_preemption_and_recompute_thrashing"
    elif p99_ttft > p50_ttft * 5.0 and preemptions == 0:
        diagnostic_hypothesis = "head_of_line_prefill_queue_blocking"
    elif prefix_hit_pct < 20.0 and p99_ttft > 1000.0:
        diagnostic_hypothesis = "cold_prefix_cache_miss_burst"
    else:
        diagnostic_hypothesis = "no_rule_matched"

    return TelemetrySnapshot(
        window_name=window_name,
        request_count=len(logs),
        mean_e2e_ms=round(mean_e2e, 1),
        p50_e2e_ms=round(p50_e2e, 1),
        p95_e2e_ms=round(p95_e2e, 1),
        p99_e2e_ms=round(p99_e2e, 1),
        p99_to_p50_ratio=round(ratio, 2) if ratio is not None else None,
        p50_ttft_ms=round(p50_ttft, 1),
        p99_ttft_ms=round(p99_ttft, 1),
        p50_tpot_ms=round(p50_tpot, 2) if p50_tpot is not None else None,
        p99_tpot_ms=round(p99_tpot, 2) if p99_tpot is not None else None,
        p99_queue_wait_ms=round(p99_queue, 1),
        peak_kv_occupancy_pct=round(peak_kv, 1),
        preemption_count=preemptions,
        estimated_recompute_tokens=recompute_tokens,
        prefix_cache_hit_rate_pct=round(prefix_hit_pct, 1),
        modeled_cost_per_1k_requests_usd=round(cost_per_1k, 4),
        diagnostic_hypothesis=diagnostic_hypothesis,
    )


def simulate_workload_logs(
    admit_watermark_pct: float = 98.5, chunked_prefill: bool = False
) -> list[RequestLog]:
    logs: list[RequestLog] = []
    for i in range(100):
        is_tail_burst = i >= 95
        if not is_tail_burst:
            logs.append(
                RequestLog(
                    request_id=f"req-{i:03d}",
                    prompt_tokens=1024,
                    output_tokens=128,
                    queue_wait_ms=14.0 + (i % 6) * 2.0,
                    prefill_ms=38.0 if chunked_prefill else 42.0,
                    decode_tpot_ms=14.5,
                    preempted=False,
                    recompute_penalty_ms=0.0,
                    prefix_cached_tokens=640,
                    kv_occupancy_pct_at_arrival=76.0 + (i % 9),
                )
            )
        else:
            burst_idx = i - 95
            if admit_watermark_pct > 90.0:
                # Over-admitting requests drives KV occupancy to 98.4% and triggers decode eviction + full recompute cascade
                cascade_queue_ms = 3200.0 + burst_idx * 850.0
                recompute_ms = 11200.0 + burst_idx * 1300.0
                logs.append(
                    RequestLog(
                        request_id=f"req-{i:03d}",
                        prompt_tokens=4096,
                        output_tokens=192,
                        queue_wait_ms=cascade_queue_ms,
                        prefill_ms=310.0,
                        decode_tpot_ms=22.0,
                        preempted=True,
                        recompute_penalty_ms=recompute_ms,
                        prefix_cached_tokens=1024,
                        kv_occupancy_pct_at_arrival=96.0 + burst_idx * 0.6,
                    )
                )
            else:
                # Admission watermark holds burst requests briefly at the gate; chunked prefill prevents HoL blocking
                gated_queue_ms = 85.0 + burst_idx * 18.0
                logs.append(
                    RequestLog(
                        request_id=f"req-{i:03d}",
                        prompt_tokens=4096,
                        output_tokens=192,
                        queue_wait_ms=gated_queue_ms,
                        prefill_ms=75.0 if chunked_prefill else 260.0,
                        decode_tpot_ms=15.0,
                        preempted=False,
                        recompute_penalty_ms=0.0,
                        prefix_cached_tokens=2048,
                        kv_occupancy_pct_at_arrival=84.5,
                    )
                )
    return logs


def main() -> None:
    unbounded_logs = simulate_workload_logs(
        admit_watermark_pct=98.5, chunked_prefill=False
    )
    gated_logs = simulate_workload_logs(admit_watermark_pct=85.0, chunked_prefill=True)

    before = diagnose_p99_spike("unbounded_98pct_kv_watermark", unbounded_logs)
    after = diagnose_p99_spike("gated_85pct_kv_plus_chunked_prefill", gated_logs)

    report = {
        "before_remediation": asdict(before),
        "after_remediation": asdict(after),
        "p99_reduction_x": round(before.p99_e2e_ms / after.p99_e2e_ms, 2),
        "recompute_tokens_eliminated": before.estimated_recompute_tokens
        - after.estimated_recompute_tokens,
    }
    print(
        json.dumps(
            {
                "execution_mode": "CPU algorithm with controlled inputs; any latency/capacity coefficients are assumptions",
                **report,
            },
            indent=2,
        )
    )


if __name__ == "__main__":
    main()
The controlled logs exercise diagnostic rules. They do not prove that a production latency spike has the same cause. A real investigation needs engine counters, request correlation, comparable workloads, and rejected-request counts.
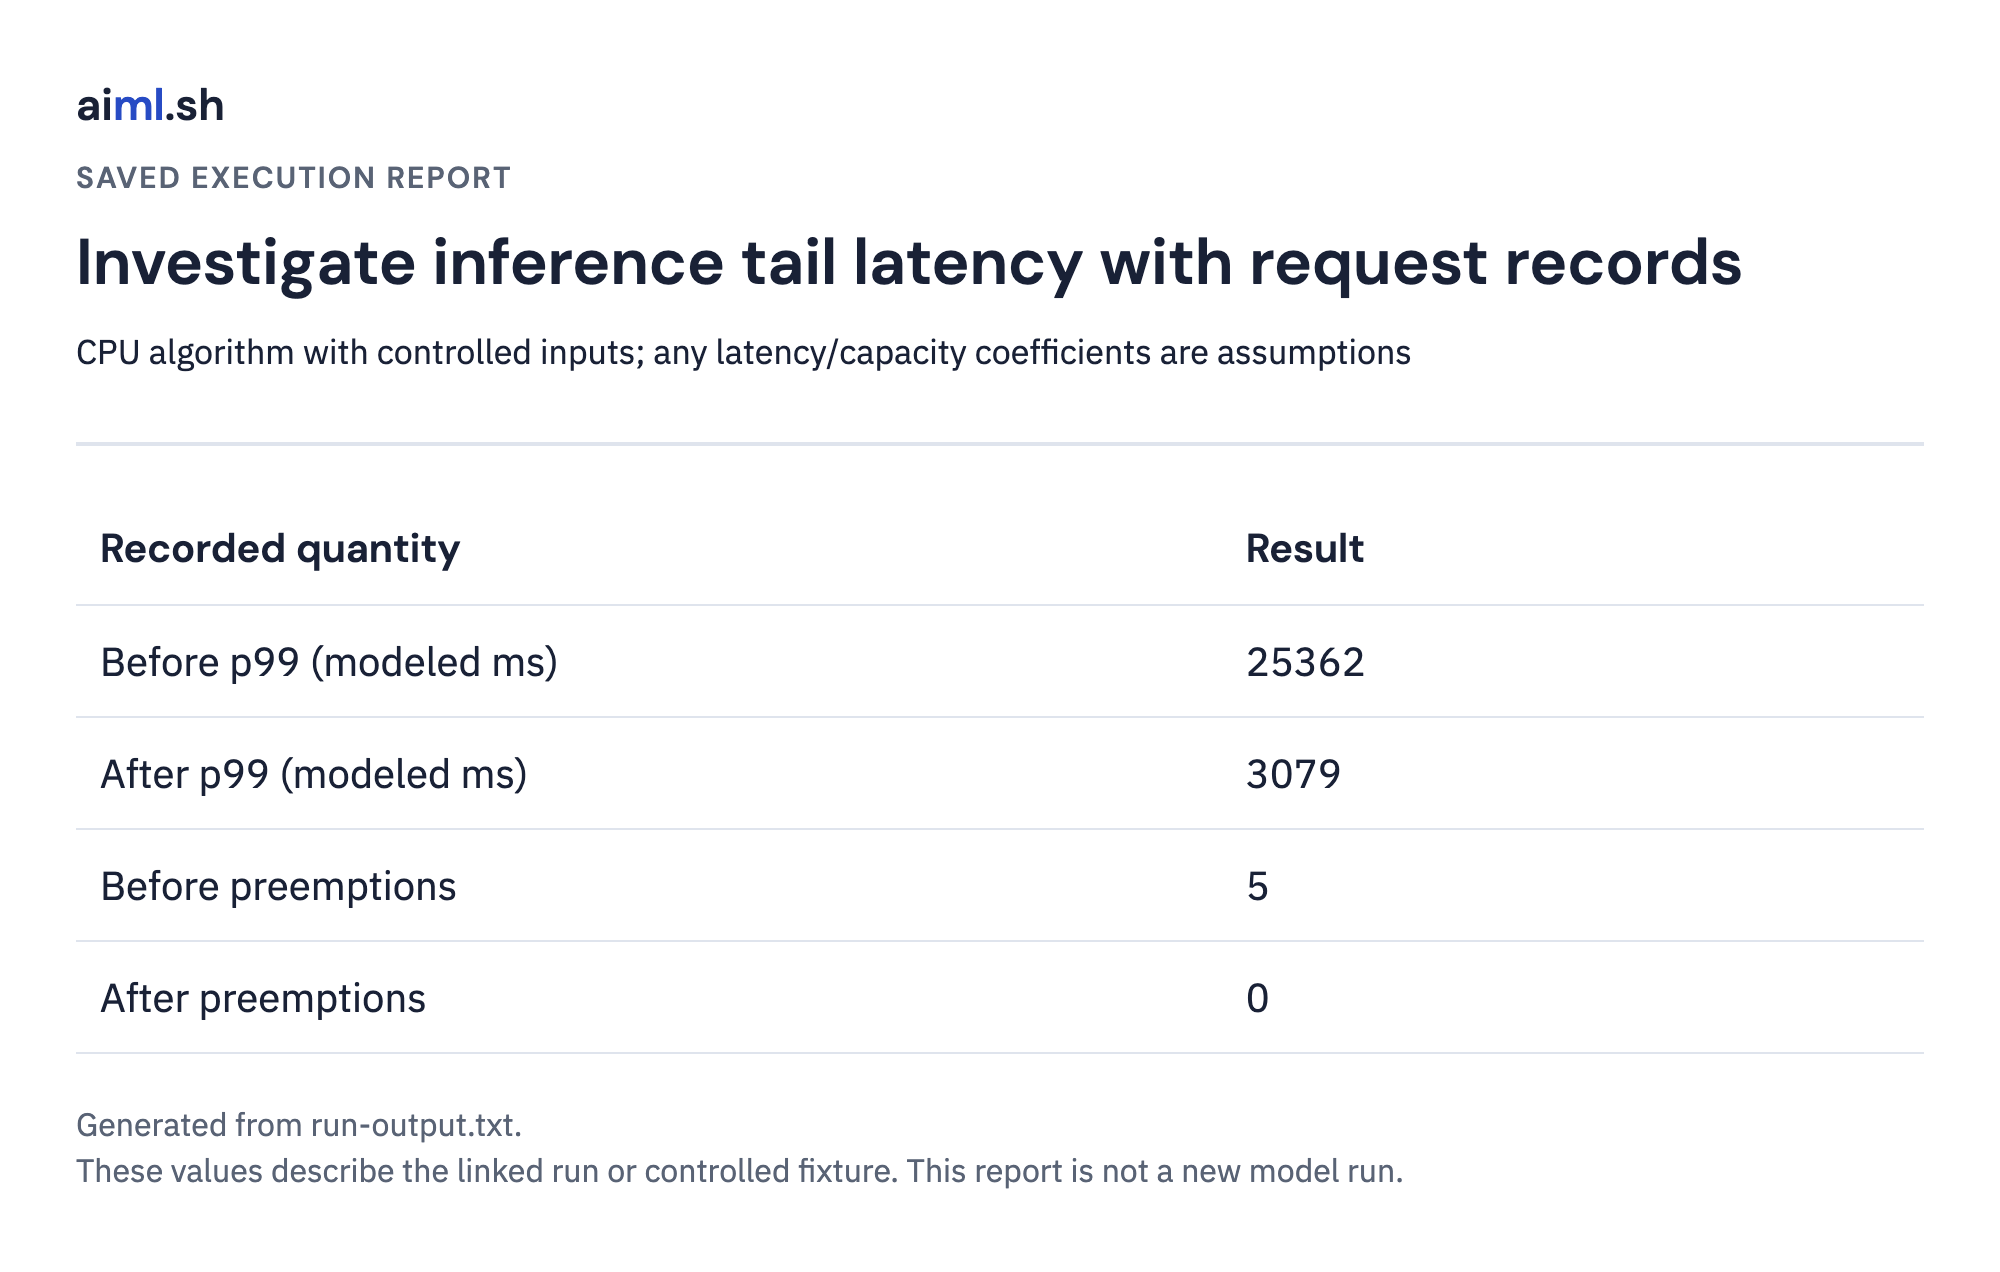
| Quantity | Recorded value |
|---|---|
| Controlled before-window requests | 100 |
| Controlled before p99 (ms) | 25362 |
| Controlled after p99 (ms) | 3079 |
Inspect the complete local result
{
  "execution_mode": "CPU algorithm with controlled inputs; any latency/capacity coefficients are assumptions",
  "before_remediation": {
    "window_name": "unbounded_98pct_kv_watermark",
    "request_count": 100,
    "mean_e2e_ms": 2967.9,
    "p50_e2e_ms": 1903.5,
    "p95_e2e_ms": 1907.5,
    "p99_e2e_ms": 25362.0,
    "p99_to_p50_ratio": 13.32,
    "p50_ttft_ms": 62.0,
    "p99_ttft_ms": 6060.0,
    "p50_tpot_ms": 14.5,
    "p99_tpot_ms": 101.06,
    "p99_queue_wait_ms": 5750.0,
    "peak_kv_occupancy_pct": 98.4,
    "preemption_count": 5,
    "estimated_recompute_tokens": 20960,
    "prefix_cache_hit_rate_pct": 56.0,
    "modeled_cost_per_1k_requests_usd": 0.1031,
    "diagnostic_hypothesis": "kv_cache_preemption_and_recompute_thrashing"
  },
  "after_remediation": {
    "window_name": "gated_85pct_kv_plus_chunked_prefill",
    "request_count": 100,
    "mean_e2e_ms": 1956.6,
    "p50_e2e_ms": 1899.5,
    "p95_e2e_ms": 1903.5,
    "p99_e2e_ms": 3079.0,
    "p99_to_p50_ratio": 1.62,
    "p50_ttft_ms": 58.0,
    "p99_ttft_ms": 214.0,
    "p50_tpot_ms": 14.5,
    "p99_tpot_ms": 15.0,
    "p99_queue_wait_ms": 139.0,
    "peak_kv_occupancy_pct": 84.5,
    "preemption_count": 0,
    "estimated_recompute_tokens": 0,
    "prefix_cache_hit_rate_pct": 60.3,
    "modeled_cost_per_1k_requests_usd": 0.0679,
    "diagnostic_hypothesis": "no_rule_matched"
  },
  "p99_reduction_x": 8.24,
  "recompute_tokens_eliminated": 20960
}
This image is an application-generated report of the saved program result, not a new inference run. Open the full-resolution report or read the raw result.
Keep tails, rejections, and denominators together
A tight admission limit can lower latency among accepted requests while rejecting more users. Report offered, accepted, failed, and rejected counts together. A small sample’s maximum is not a stable estimate of production p99, and a single watermark cannot fit every model and workload.
Averages hide outliers. A controlled window has a moderate mean alongside large tail values. The report retains both rather than using the average as a latency guarantee.
Preemption records. The supplied log window contains preemption flags and penalties that support a diagnostic hypothesis. The recompute token quantity and cost are explicitly estimates, not engine counters or a bill.
Read the executable checks
"""Unit and failure-boundary tests for inference telemetry and 10x p99 spike diagnostics."""

from __future__ import annotations

import unittest

from lab import (
    RequestLog,
    diagnose_p99_spike,
    simulate_workload_logs,
)


class TestInferenceMetricsAndP99Spikes(unittest.TestCase):
    def test_single_token_and_zero_duration_metrics_are_undefined(self):
        row = RequestLog("one", 1, 1, 0, 0, 9, False, 0, 0, 0)
        result = diagnose_p99_spike("one", [row])
        self.assertIsNone(result.p50_tpot_ms)
        self.assertIsNone(result.p99_tpot_ms)
        self.assertIsNone(result.p99_to_p50_ratio)

    def test_kv_headroom_gating_and_chunked_prefill_collapse_p99_spike(self) -> None:
        before = diagnose_p99_spike(
            "unbounded",
            simulate_workload_logs(admit_watermark_pct=98.5, chunked_prefill=False),
        )
        after = diagnose_p99_spike(
            "gated",
            simulate_workload_logs(admit_watermark_pct=85.0, chunked_prefill=True),
        )
        self.assertGreater(before.p99_to_p50_ratio, 10.0)
        self.assertEqual(
            before.diagnostic_hypothesis, "kv_cache_preemption_and_recompute_thrashing"
        )
        self.assertLessEqual(after.p99_to_p50_ratio, 2.1)
        self.assertEqual(after.preemption_count, 0)
        self.assertEqual(after.diagnostic_hypothesis, "no_rule_matched")
        self.assertLess(
            after.modeled_cost_per_1k_requests_usd,
            before.modeled_cost_per_1k_requests_usd,
        )

    def test_averaging_latency_hides_10x_p99_preemption_spike(self) -> None:
        logs = simulate_workload_logs(admit_watermark_pct=98.5, chunked_prefill=False)
        snap = diagnose_p99_spike("unbounded", logs)
        # p50 and mean look deceptively low (< 3.1s), while p99 exceeds 23s (>12x p50)
        self.assertLess(snap.p50_e2e_ms, 2000.0)
        self.assertLess(snap.mean_e2e_ms, 3100.0)
        self.assertGreater(snap.p99_e2e_ms, snap.p50_e2e_ms * 10.0)
        self.assertGreater(snap.p99_e2e_ms, snap.mean_e2e_ms * 7.0)

    def test_kv_thrashing_cascades_recompute_queue_delay(self) -> None:
        logs = simulate_workload_logs(admit_watermark_pct=98.5, chunked_prefill=False)
        preempted_reqs = [r for r in logs if r.preempted]
        self.assertEqual(len(preempted_reqs), 5)
        # Each subsequent preempted request suffers strictly worse queue wait and recompute delay
        for prev, curr in zip(preempted_reqs, preempted_reqs[1:]):
            self.assertGreater(curr.queue_wait_ms, prev.queue_wait_ms)
            self.assertGreater(curr.recompute_penalty_ms, prev.recompute_penalty_ms)


class TelemetryBoundaryTests(unittest.TestCase):
    def test_no_matching_rule_does_not_claim_slo_success(self):
        from lab import RequestLog

        record = RequestLog("slow", 32, 2, 60000, 100, 10, False, 0, 32, 50)
        result = diagnose_p99_spike("slow", [record])
        self.assertEqual(result.diagnostic_hypothesis, "no_rule_matched")
        self.assertEqual(result.p99_ttft_ms, 60100)

    def test_first_token_is_not_counted_as_an_extra_decode(self):
        from lab import RequestLog

        self.assertEqual(RequestLog("one", 32, 1, 4, 6, 10, False, 0, 0, 50).e2e_ms, 10)


if __name__ == "__main__":
    unittest.main()


class GuardBoundaryTests(unittest.TestCase):
    def test_rejects_invalid_boundary_inputs_with_specific_reason(self):
        import lab
        cases = [('percentile([],50)', 'empty list'), ('diagnose_p99_spike("empty",[])', 'logs must'), ('RequestLog("x",0,1,0,0,1,False,0,0,0)', 'token counts'), ('RequestLog("x",1,1,-1,0,1,False,0,0,0)', 'measurements')]
        for code, reason in cases:
            with self.subTest(code=code):
                with self.assertRaisesRegex((ValueError, MemoryError, KeyError, RuntimeError), reason):
                    exec(code, vars(lab).copy())
Try a change and explain the result
Compare the average with the tail in the controlled windows. Identify which fields support the preemption hypothesis and which measurements are still missing. In the actual HTTP run, inspect failures rather than silently dropping them.
Read the explanation
Evaluate offered and completed work together. Accepted-only tail latency does not describe the whole service.
Investigate rather than infer causality
Collect bounded content-free metrics and retain request correlation IDs without logging prompts. Use engine metric names from the installed version. Compare equivalent workload windows and denominators before attributing improvement to one setting.
References
Sources checked October 24, 2026. Runtime-specific commands and results apply to the recorded versions; linked rolling documentation can change. The application scenarios are teaching examples, not claims about an author’s production incident.